OmniNexus Team
How to Read Ad Results Without Fooling Yourself
Plain definitions of reach, CPM, CTR, CPC and ROAS, the traps that waste budget, and one main number to watch for each goal, with worked examples in RM and AED.
You boosted a post last week. The dashboard shows a wall of numbers, some green, some red, and you are not sure which one decides whether the money was well spent. So you pick the number that looks best and call it a win.
Every metric answers one narrow question. Use it for the wrong question and it misleads you quietly. Here is what each one means, what it can't tell you, and how to choose the number that matters.
The numbers, in plain words
Say you run an online fashion store in Petaling Jaya. This is an invented example. You spend RM500 on one ad. It is shown 50,000 times to 20,000 different people. 750 people click, and 15 of them buy, with an average order of RM120. We will use these figures all the way down, and the table shows each one worked out.
| Metric | How it works, with the example | What it can't tell you |
|---|---|---|
| Reach | Different people who saw the ad: 20,000 | Whether anyone cared |
| Impressions | Times shown, counting repeats: 50,000 | How many people, as one person can account for several |
| Frequency | Impressions divided by reach: 2.5 views each | Whether that is too many for your product |
| CPM | Cost of 1,000 impressions: RM10 | What that attention did |
| CTR (click-through rate) | Clicks divided by impressions: 1.5% | Whether they were the right people |
| CPC (cost per click) | Spend divided by clicks: about RM0.67 | Whether a visit became a customer |
| Conversion rate | Share who do what you wanted: 2% | Whether the ad found good people |
| Cost per result | Spend divided by results counted: about RM33.33 | Which result you counted |
| ROAS (return on ad spend) | Revenue divided by spend: 3.6 | What the goods cost you |
Frequency warns you when the same people see the ad again and again. Cost per result can count an order, a lead, a booking or a view, so always say which. For ROAS, 15 orders at RM120 is RM1,800, and RM1,800 divided by RM500 is 3.6, which tells you how much revenue came back per ringgit.
The ROAS blind spot matters. Say each order costs you RM70 in stock, packing and delivery. Then each sale leaves RM50, so 15 orders leave RM750. After the RM500 ad spend you keep RM250. A ROAS of 3.6 sounds great and still leaves a thin profit. Always check ROAS against your own margin.
Trap 1: chasing cheap clicks
Say a second ad for the same store uses a funny meme. It gets 2,000 clicks for RM500, so CPC is RM0.25, much lower than the first ad. It brings 4 orders. Cost per order is RM125.
The first ad cost more per click and cost far less per order: about RM33.33 against RM125. Cheap clicks often come from people who are amused, not people who want to buy. Judge the ad by what comes after the click.
Trap 2: treating likes as success
Likes, comments and shares show that a post caught attention. That is useful for learning what people respond to. It is a weak stand-in for money. A post can collect hundreds of likes and bring no enquiries, while a plain post with few likes brings a steady stream of bookings.
Trap 3: judging after one day
Day-to-day results swing. A Monday differs from a Saturday, and one quiet evening can make a good ad look dead. With few results, one extra order changes your cost per order a lot.
Decide in advance how long you will wait and how many results you need before you judge. For most small businesses that means at least a full week, so every day of the week shows up once.
Trap 4: comparing ads with different goals
An ad built to get views will show a low CPM and a high reach. An ad built to get orders will show a higher CPM, because it is shown to people more likely to act. Put them side by side and the first looks cheaper. Both can be doing their job.
Compare ads only when they share a goal, and compare them on that goal's number.
Trap 5: trusting one source of attribution
Your ad platform says 15 orders came from the ad. Your shop's order records say 11. A few customers messaged you on WhatsApp and said they saw you on Instagram, but those orders show up under no ad at all.
Each source sees part of the picture. Platforms may claim sales that would have happened anyway. Your own records miss people who saw the ad, then searched for you by name.
Pick one record you trust, usually your own order or enquiry log, and use the platform numbers as a second opinion. Add a simple question to your form or chat:
How did you hear about us?
Keep the method the same from one campaign to the next, so you compare like with like.
Pick one main number per goal
Before you spend, write down the goal and one number that measures it. Look at the others only to explain what you see.
- Awareness: reach, with frequency as a check. You want many different people to see you, not the same few over and over. Cost per 1,000 people reached is the price to watch.
- Traffic: cost per landing page view, if your platform gives it, or CPC if not. Landing page views count people who actually loaded the page, which filters out accidental taps.
- Leads: cost per lead, then cost per qualified lead once you know which enquiries were real.
- Sales: cost per order and ROAS, checked against your margin.
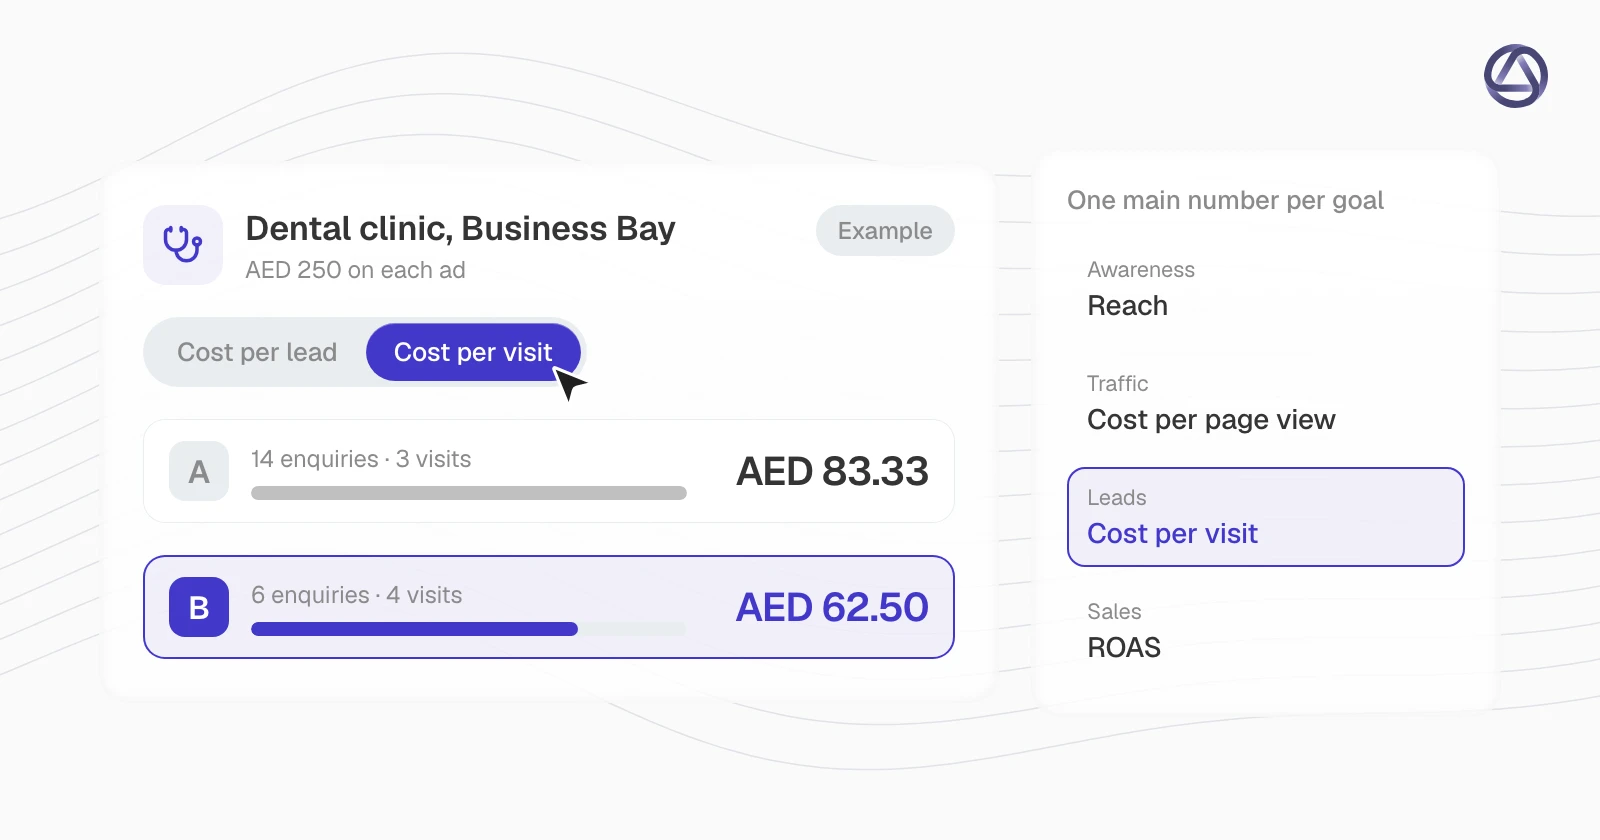
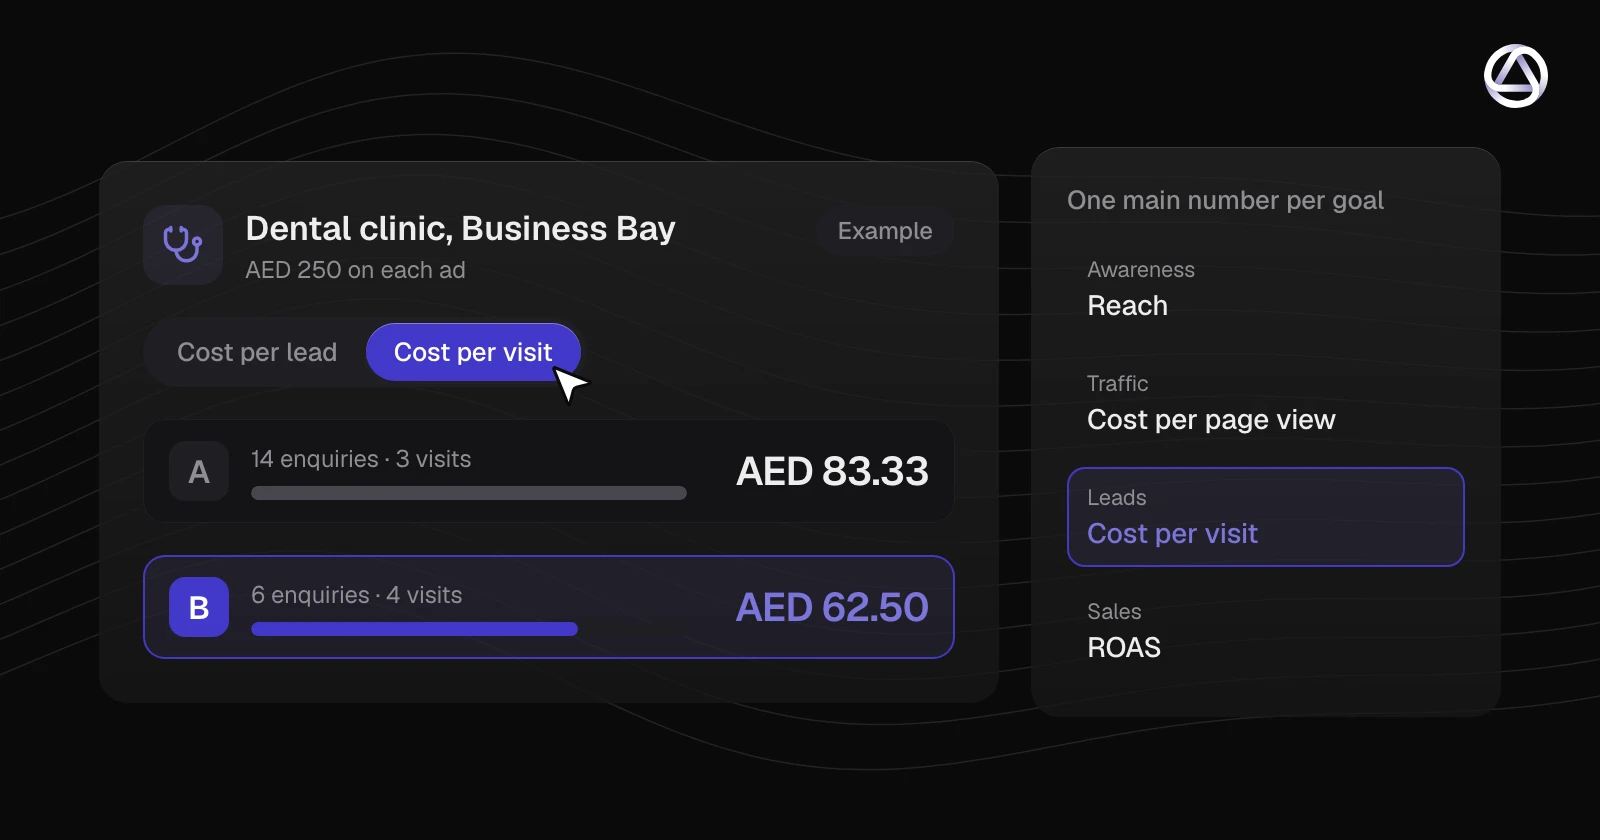
Here is the leads case with a clinic. Say you run a dental clinic in Business Bay, Dubai, and test two ads, AED 250 each, to get people to message you on WhatsApp.
- Ad A brings 14 enquiries. Cost per lead is about AED 17.86. Of those, 3 people attend an appointment.
- Ad B brings 6 enquiries. Cost per lead is about AED 41.67. Of those, 4 people attend.
On cost per lead, Ad A wins easily. On cost per attended visit, Ad A is AED 250 divided by 3, about AED 83.33, and Ad B is AED 250 divided by 4, AED 62.50. The cheaper lead was the more expensive patient. With so few people, you would want another round before you commit, but you can already see why the lead count alone misled you.
Follow the number as far down the line as you can. Count attended visits, not only enquiries.
A short routine
- Write the goal and its one main number before the ad goes live.
- Set how long you will wait and how many results you need before you judge.
- Compare ads only against ads with the same goal.
- Record results in your own sheet, from your own orders or enquiries.
- Change one thing at a time between versions, such as the photo or the headline, so you know what moved the number.
Where Marvis fits
Marvis drafts the ads and posts. You decide what to boost and how much to spend. Its analytics tracks likes, comments and shares on every post, so you can see which posts did best and worst. Treat those as a hint about what catches attention, and read your sales or enquiry counts from your own records. If you want to try it, start at /sign-up.
Your next step takes five minutes. Take your last ad, write down its goal, then calculate its cost per result by hand from your own records. If you can't, that is the first thing to fix.